Companies screened per month went up 300%. Research time per company fell from about six hours to twenty minutes. Cost per report dropped roughly 90%.
300%more companies screened
90%lower cost per report
25industries mapped by hand
Research time per company
Analyst desk research360minutes
One run20minutes
18× less time than before
What comes back from one paragraph of input
Mapped competitor sectors10
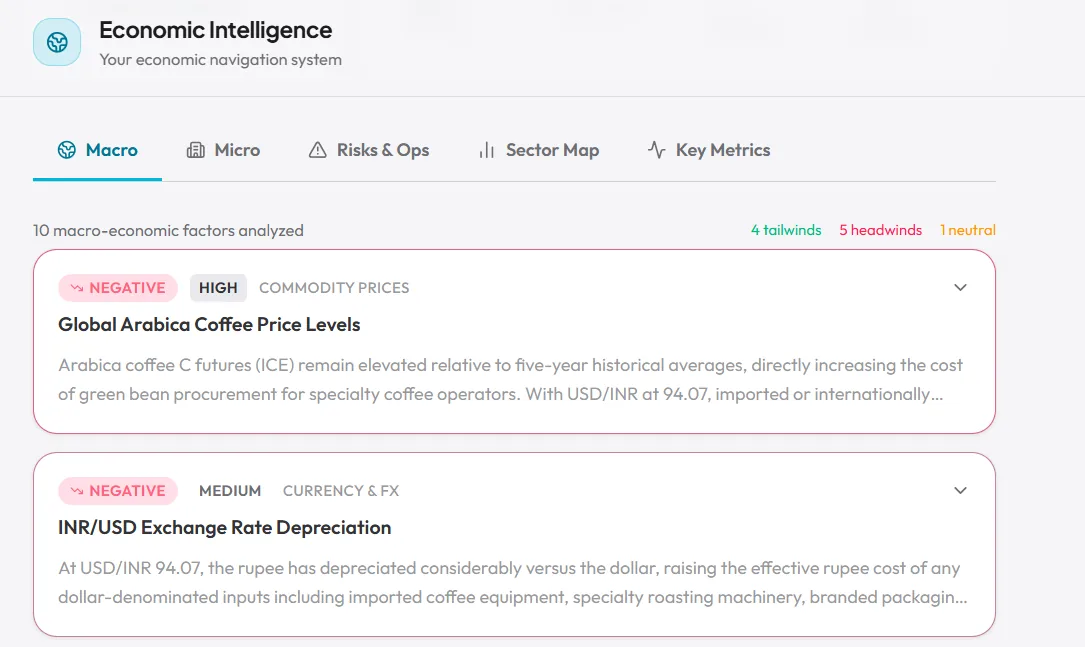
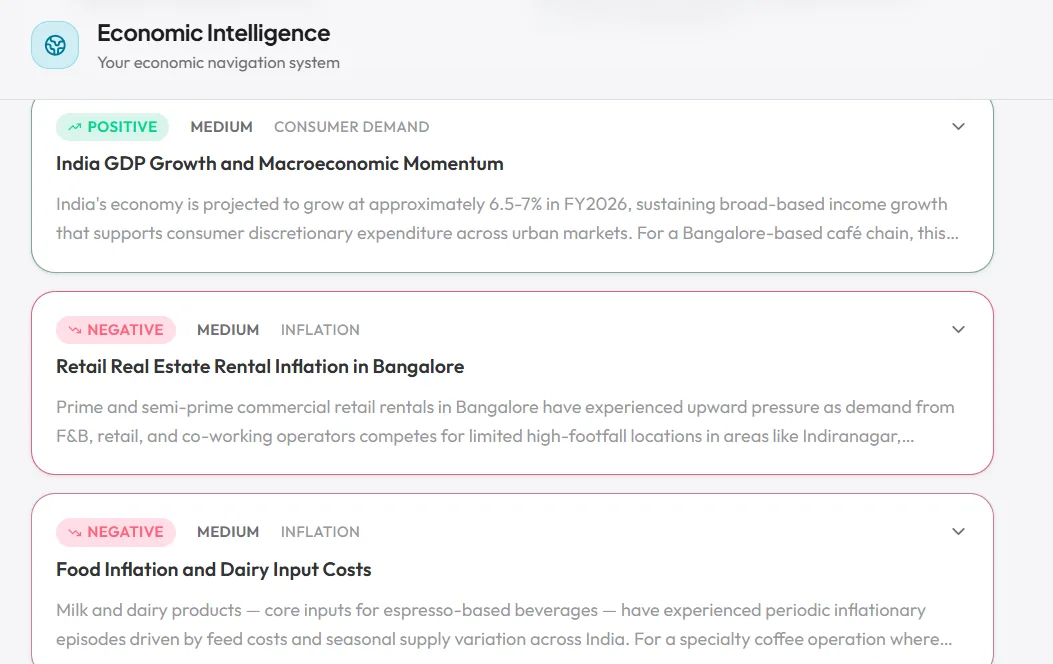
Wider economic factors9
Business-specific factors7
Metrics to watch6
Risks5
Opportunities5
The problem, in their words
There is no affordable way to answer which economic forces are acting on this specific business, right now. A consulting deliverable is weeks and lakhs. Macro newsletters are interesting but never specific enough to act on.
For a family office running diligence on dozens of companies a year, across two very different markets, that gap is expensive either way. Pay consulting rates per company, or make the call on general reading.
How it works
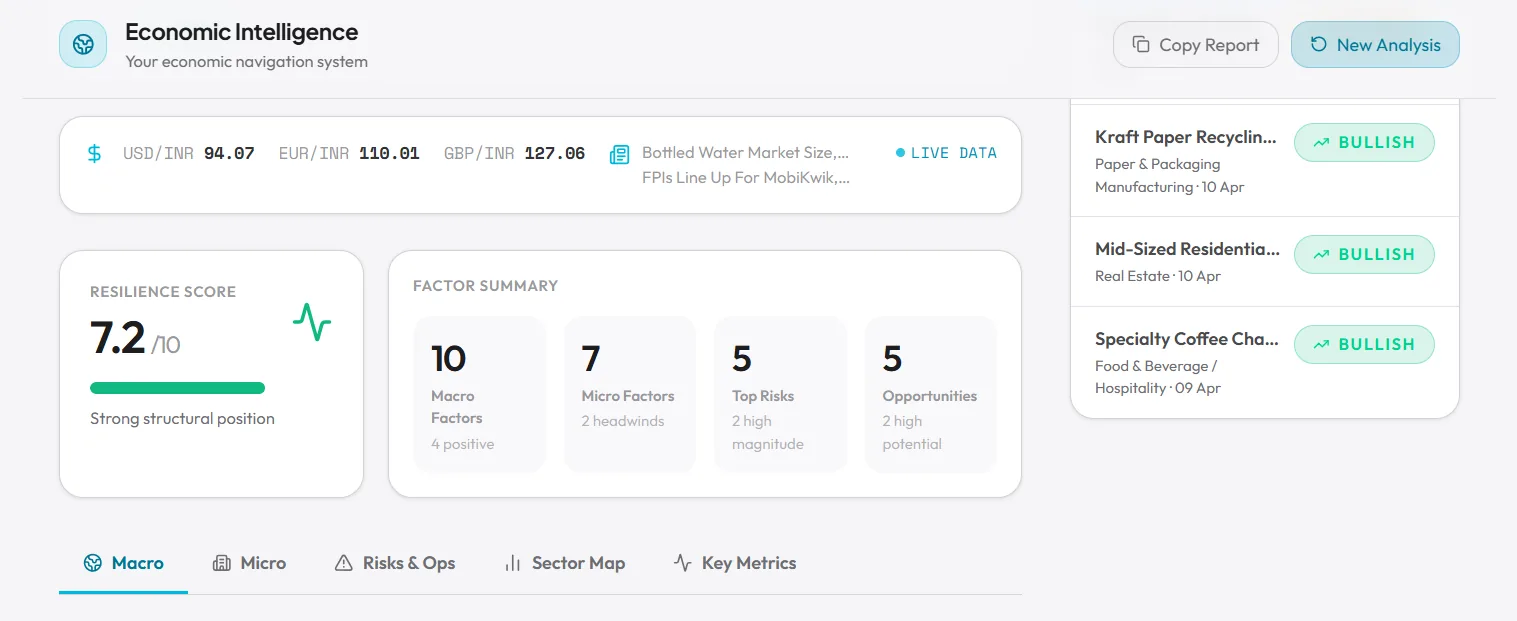
You describe a business in a paragraph and say where it operates and how big it is. You get back a structured economic report about that business: what is helping it, what is working against it, and what to watch.
Stack Python, Node.js, Next.js, Google Cloud.
Real numbers first, then the analysis
Before a word is written, the system pulls live exchange rates and current industry headlines. The report is built on today’s figures, and the page shows you exactly which ones it used. That bar across the top is the difference between analysis and a machine talking confidently.
Industry knowledge is written down, not guessed
Which commodities and interest rates actually move a business is mapped by hand across 25 industries. Coffee tracks Arabica. Airlines track fuel and the rupee. That mapping is fixed and reviewable, because it is the kind of thing AI will happily get subtly wrong.
It works in two smaller steps
The system builds the picture of the business first, then uses that to map the competitive landscape. Two shorter answers stay accurate. One very long answer is where these systems start making things up.
No doom, by design
The system is not allowed to reach for words like crisis or collapse, and has to hedge where the evidence is thin. An alarming report is easy to produce and useless to the person who actually has to run the business.
What shipped
One page: describe the business, get the report.
A live data bar showing the exact exchange rates and headlines behind the run.
A resilience score and sentiment read at a glance.
Five sections covering the wider economy, the business itself, risks, opportunities, the competitive map and the metrics to watch.
A history sidebar, so past runs are one click away.
The outcome
Companies screened per month went up 300%. Research time per company fell from about six hours to twenty minutes. Cost per report dropped roughly 90%.
The three numbers move together, and the order matters. Six hours down to twenty minutes is a productivity gain. The 90% cost drop is what turns that gain into a change in behaviour, because screening stops being something you ration.
The 300% is the real result: the firm now analyses companies it would previously have passed over unexamined. Not because the analysis got faster, but because it got cheap enough to be the default rather than a decision.
Building something like this?
We take on a small number of clients at a time and work directly with them. Tell us what is slow, manual or messy, and we will tell you honestly whether we can help.